2025 Garmin Connect data report
It’s time to look back at your health and fitness trends for 2025. How did you do?
It’s no secret Garmin users love their data. After all, that’s why you wear Garmin smartwatches to begin with. Every year, we unpack that data to provide a comprehensive look at just how active and wellness-focused you were.
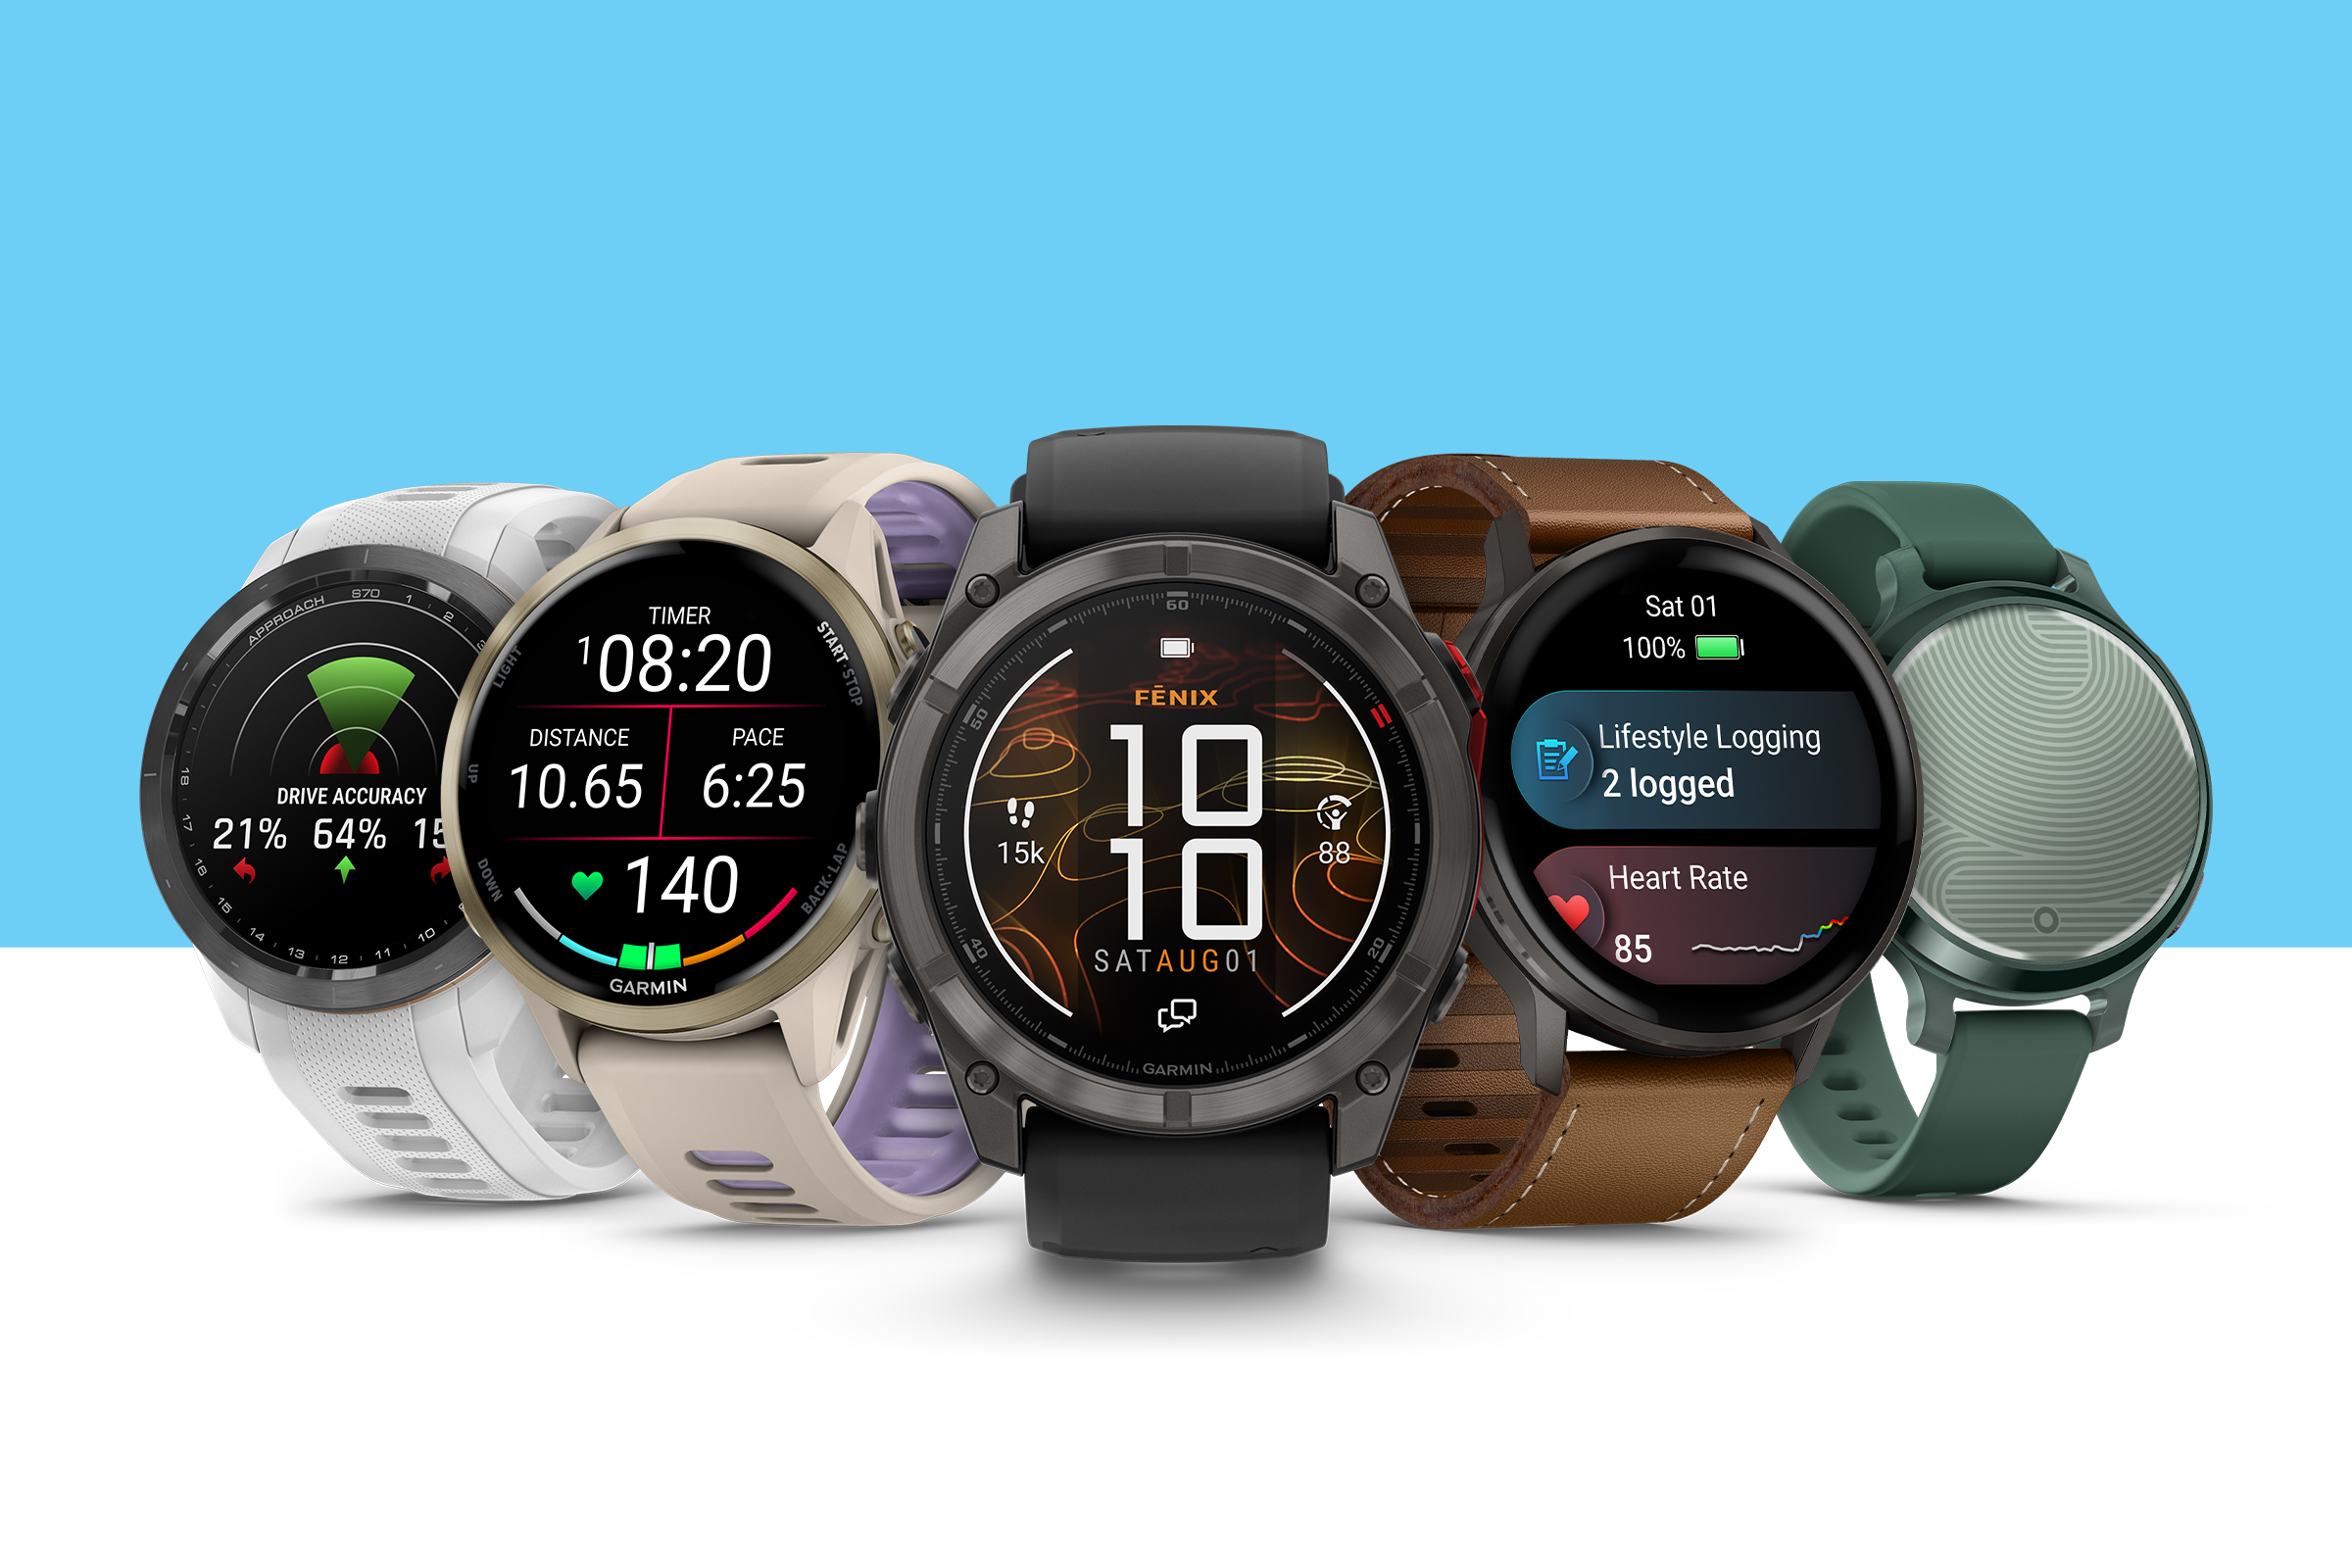
This data comes from tens of millions of Garmin watches worn all over the world. And with more than 100 built-in activity apps — plus a wealth of health and wellness insights — we’ve got some pretty compelling knowledge to drop.
Who stressed less — men or women? What locale dominated average step counts? Is Vietnam really serving a big advantage when it comes to racket sports? Thanks to the Garmin Connect™ app — and our extensive community of users — we have all the answers. But first, a few key takeaways from our annual data deep dive:
- Garmin users are getting more active — and they especially love strength training and racket sports. Pickleball, anyone?
- Whether Garmin users were 18 or 70 years old, each generation had one activity they loved the most. They recovered differently too.
- More than half of Garmin users recorded 8,000 or more steps a day on average. The overachievers took their step count to extremes — more than doubling that number.
- You were committed to setting your personal records — and earned unique Garmin Connect badges while you were at it.
One note before we get started: All the data below is on a per capita basis. We just thought you should know.
How active were Garmin users in 2025?
If there’s one thing we know about Garmin users, it’s that you love getting active. No matter how you move your body, you’re moving more.
Garmin Connect users performed 8% more activities in 2025 compared to 2024. The top five activities were running, walking, cycling, strength training and indoor cardio.
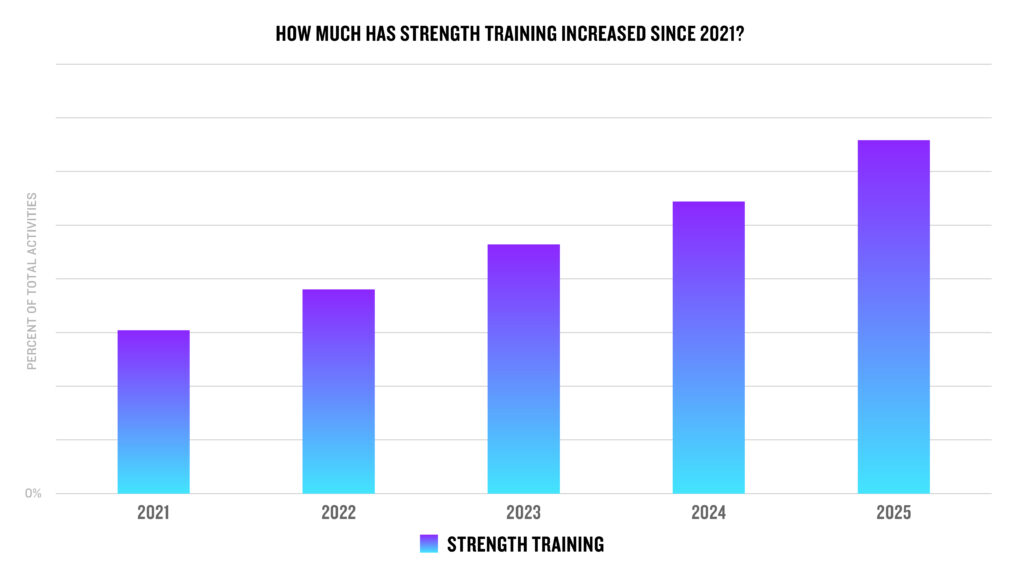
Strength training: This activity increased 29%. It’s the fourth year in a row that strength training has increased more than 20%. Plus, women did 6% more strength training than men in 2025. And we have to give a quick shout-out to the gym rats in Brazil, who did 44% more strength training activities per user than those in the next highest country, Mexico.
Running: Whether you were a new runner in 2025 or you already used our free race day features on your running smartwatch, Garmin runners showed their dedication this year. Outdoor running — with Japan leading the way — increased 6%, while indoor running was up 16%, with Norway runners taking the lead. Men went on 21% more outdoor runs than women, while women did 16% more indoor runs.
Hiking: Garmin users love hitting the trails — and showed it too, with hiking increasing 12% in 2025. Slovenia hikers had the highest rate of hiking activities by user. Might we recommend using Garmin Trails to find your next hike? We can also help you choose the best GPS watch for hiking or backpacking here.
Racket sports: Whether you played pickleball, badminton, table tennis, racquetball or another racket sport, you were part of a 67% increase. Women and 18– to 29-year-olds drove this increase, with Garmin users in Vietnam swinging the racket the most per capita.
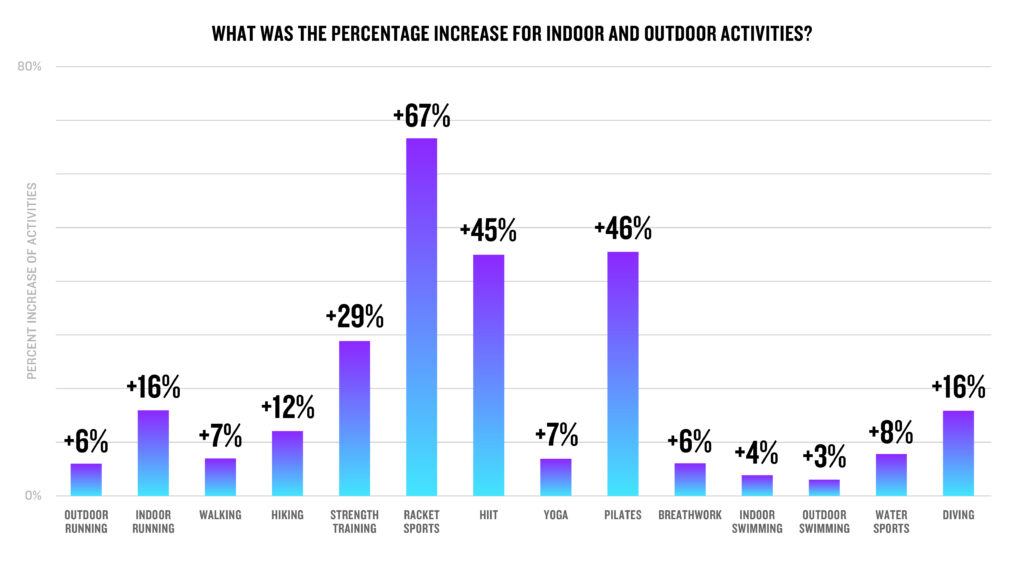
Those are just a few of the broad range of activities that you can do with Garmin. Let’s look at just how much activities have increased for indoor and outdoor activities.
After racket sports, Pilates and high-intensity interval training (HIIT) activities saw the largest increases this year. (If you need help coming up with your next HIIT workout, we can help). The number of dive activities increased 16%, while walking and yoga activities both increased 7%.
Our winter sports aficionados were hitting the slopes more too, with an increase of 8%. Garmin users were also committed to taking deep breaths, with the breathwork activity increasing 6%. Last, but not least, our aquatic friends made the most out of their swim workouts as indoor swimming increased 4% and outdoor swimming increased 3%.
How and when do Garmin users exercise?
Garmin users spent about 55 minutes per activity on average.
Let’s look at running, walking and cycling. More than a quarter of runs recorded were 30-45 minutes long, while walkers tended to stick closer to 15- to 30-minute walks. Nearly half of cycling activities lasted an hour or longer — we know it takes time to stay dedicated to the pedals.

Different generations also had their preferences on just how they were getting that exercise done.
- 18–29: They did the most outdoor running and led track running.
- 30–39: This age group logged the most strength training, indoor cardio and treadmill activities.
- 40–49: They did the most trail running of any age group.
- 50–59: This age group dominated the indoor cycling, lap swimming and mountain biking categories.
- 60–69: They led outdoor cycling, along with walking and hiking.
- 70+: This age group spent the most time on the course golfing.
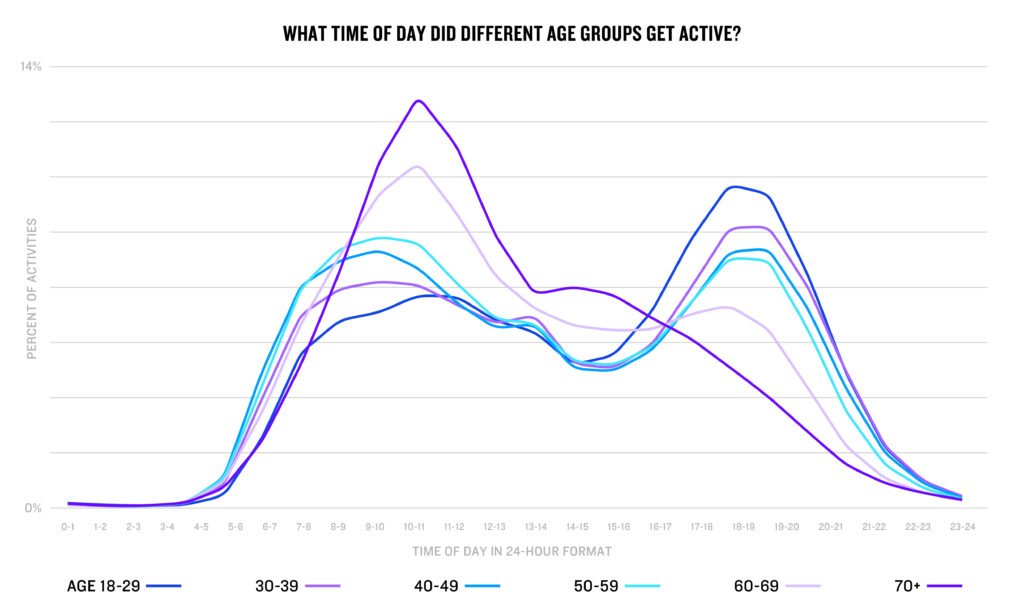
Older users tended to do more activities in the morning, while younger users tended to wait until later in the day. Users over 70, for example, more commonly started activities between 8 a.m. and 10 a.m., while users between 18-29 years old more frequently started activities between 4 p.m. and 7 p.m.
How many steps did you take?
We know you love tracking your steps — and hitting your step goal. And as usual, you’re beating yesterday. Garmin users took 1.2% more steps on average in 2025 compared to 2024.
Wondering what locales had the highest average steps per day? Kudos to Garmin users in Hong Kong, who once again took the top spot.
- Hong Kong: 10,663 steps.
- South Korea: 9,969 steps.
- Spain: 9,937 steps.
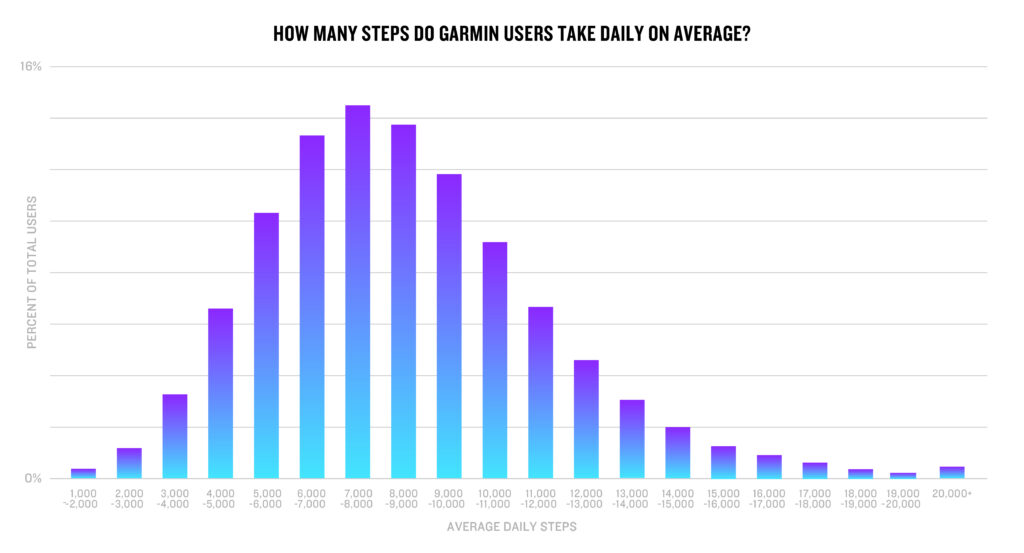
More than 50% of Garmin users achieved 8,000 or more steps each day on average, while 28% of users took 10,000 or more steps on average. Some of you (well, 0.4% of you to be exact) took your step goals to the extreme, averaging 20,000 or more steps per day — and we love to see it.
How stressed were Garmin users?
Stress data provides insight into how your body is regulating itself. Your Garmin smartwatch primarily uses your heart rate and heart rate variability (HRV) data to calculate your stress level1, which can range from 0–100.
Women were 3% less stressed than men on average. And the older a Garmin user was, the higher their average stress score tended to be.
Congratulations to the Netherlands, which had the lowest average stress score, followed by Belgium, Portugal, Ireland and the United Kingdom.
If you’re feeling stressed, don’t forget to pause — and check out our breathwork and meditation features available on your compatible Garmin smartwatch. Breathwork activities can help increase awareness, reduce stress, improve mental sharpness, boost work performance and prepare for sleep.
How did your Body Battery™ drain?
Garmin Body Battery energy monitoring is designed to help you monitor how much you have left in the tank, connect the dots between stress, recovery, sleep and physical activity1. It’s typically the highest when you first wake up and drops by the time you go to bed.
Different age groups experienced their Body Battery differently. Younger Garmin users tended to have higher highs and lower lows, meaning they expended more energy throughout the day than older users.
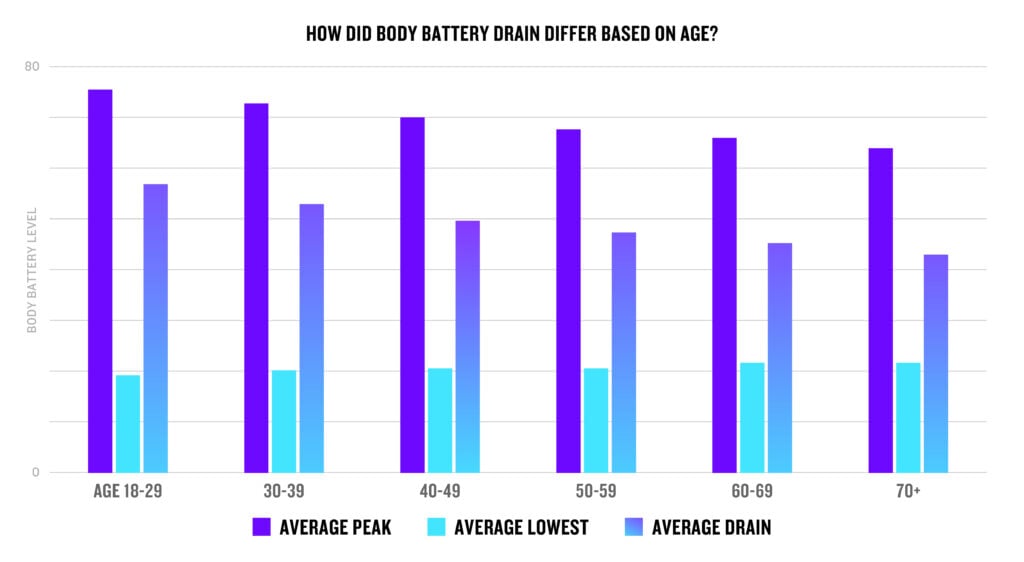
Average peak: Users in Portugal were the most refreshed with the highest average peak at 74, while Japanese users were the least refreshed with the lowest average peak at 65.
Average lowest daily Body Battery score: Garmin users in South Africa conserved more energy than most other locales and had the highest average low point at 24. Kazakhstan had the lowest average at 14 and the least energy conserved.
Average drain: Chinese users expended the most energy throughout the day and had the highest average drain, while South African users expended the least energy and had the lowest average drain.
What badges did you earn in Garmin Connect?
We know you love your Garmin Connect badges. These offer a quick way to track your progress, receive points and recognition for your efforts, and connect with other users. When you’re in a slump, badges reward you for your efforts. And when your competitive spirit gets the best of you, badges ensure you’ve got bragging rights.
(Looking for badge inspiration? Find badges you never knew you needed here).
When you earn badges, you’ll accrue points. Garmin Connect users gained an average of 18 points in 2025.
We love how dedicated you were to taking care of yourself this year: The most earned badge overall was Global Wellness Day.
Some Garmin Connect users took their step goal to another level entirely: 0.5% of all users earned the Appalachian Trail expedition badge in 2025, for a total of 1.5% of users to ever receive the badge. To earn this badge, you must use your Garmin smartwatch to track your steps and reach 2,200 miles (3,500 kilometers).
Did you hit the stair climber more this year? Or perhaps you used those office walks to climb a couple flights of stairs — maybe the equivalent of climbing Mount Everest? If you kept it up, you may have been one of just 0.2% of all users who earned the Everest expedition badge this year. Only 0.7% of users have claimed the Everest expedition badge, climbing 29,029’ (8,848 meters).
And for Garmin Connect+ users, it’s time to check out your own highlight reel: It’s your Garmin Connect Rundown, and it’s available now. Receive a personalized annual report of your health, performance and activity stats, including total steps, average sleep score, total of each activity types and more.
Whether you see yourself at the top of these rankings, or you want to improve your own stats, browse the full Garmin collection of smartwatches to track your activities and get personalized health and wellness insights.