Garminの睡眠モニタリング機能の背景とは
Garminは、2018年6月、睡眠のステージをより正確に特定する睡眠モニタリング機能を発表しました。この機能は、臨床デバイスで取得された生データに反し開発され、米国精神神経科委員会、米国睡眠医学委員会の資格をもつ、米国カンザス大学メディカルセンター(KUMC)睡眠医学クリニックのダイレクターであるスーザン・スティーブンズ医師の指導の下、Garmin Healthが実施した睡眠研究の成果です。
スティーブンズ医師は、2019年5月7日に米国神経学学会の総会にて、研究の詳細を発表しました。ポスター発表では、研究デザイン、結果、そしてGarminのウェアラブルが睡眠のステージを推定するための有効な方法を示しているという結論をまとめました。ユーザーにとって、これは睡眠状態や睡眠パターンがどのようにその人の健康に影響を与えているか、貴重な洞察につながります。また、研究者にとっては、Garminの睡眠モニタリング機能のあるウェアラブルが、被験者の活動量や睡眠のパターンのモニタリングがターゲットである継続的な研究に適している可能性を示しています。
同様の研究とは対照的に、Garmin HealthとKUMCの研究は睡眠クリニックでではなく、日常生活の環境で実施されました。研究の参加者は、自宅の自分のベッドで臨床用デバイスを使用し、日常の睡眠パターンのデータを提供しました。睡眠時の無呼吸を防止するCPAP(シーパップ:持続陽圧呼吸療法)や手首にタトゥのある参加者は除外され、一般のウェアラブルディバイスのユーザーを想定してすでに分かっているものや未解明の睡眠状態のデータが集められました。
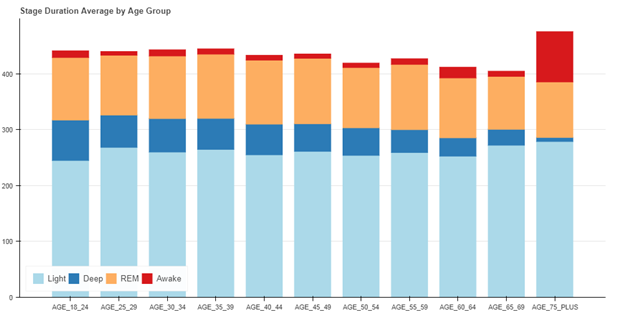
この研究以外に、評価テストにてデータ収集された3,200夜分の睡眠のアルゴリズムのパフォーマンスが、年齢グループごとの睡眠ステージの平均分布に関する臨床データと合わせて確認されました。その結果は、年齢とともに深い睡眠と睡眠時間が減少するという予測された結果と一致していました。
Garmin Healthは、Garminウェアラブルと高精度のセンサーデータを活用して、従業員の健康、市民の健康、そして患者モニタリング、研究での使用が可能なソリューションを提供します。その背景には、正確性などを証明、またはより正確なモニタリング機能の提供をするべく実施されるこういった研究などの活動があります。
Commercially Available Wearable
Provides Valid Estimate of Sleep Stages
Scott Burgett1,Robert Blair1, Darrell Lightfoot2, Catherine Siengsukon3, Adam Reetz1, Suzanne Stevens2
1Garmin International, 2Neurology, University of Kansas Health Systems, 3University of Kansas Medical Center
Introduction
In the
last several years there has been an explosion of smart wearable devices that
are capable of measuring steps, activity, heart rate, and other biometric data
about the wearer. An estimated 117 million smart wearables will be sold in 2019,
with that number rising to 233 million in 2022 [1]. Actigraphy has been the gold standard for many
years to estimate sleep stages using wearables. Actigraphy uses accelerometer
information to estimate wake/sleep periods of the user [2]. Many modern
wearables also measure heart rate and heart rate variability by using optical photoplethysmography
(PPG). PPG uses light emitted into the skin to measure pulse rate by observing
small changes in the intensity of the reflected light due to capillary blood volume
changes as the pulse pressure wave transits the sensor field of view. The use
of actigraphy, heart rate, and heart rate variability together provides the
opportunity to estimate more than just wake/sleep, such as light (N1 and N2),
deep, and REM stages of sleep.
Although many wearables purport to accurately distinguish between light and deep sleep [3], little information is available on the validity of using wearables in this manner. A previous study by Fitbit described a non-production method to estimate sleep stages in a healthy adult population using PPG and actigraphy in a wearable device [4]. This study describes the method and results of using optical PPG and actigraphy in a wearable device (a vivosmart 3 manufactured by Garmin International) to estimate sleep stages in a population of adults.
Method
This study involved recruiting
subjects to wear a Garmin vívosmart 3 and a reference device so that the
accuracy of the Garmin device in estimating sleep stages could be assessed. The
most accurate method to determine sleep stages involves the use of in-laboratory
polysomnography (PSG), which includes the use of EEG, EOG, and EMG sensors. However,
the use of an in-laboratory PSG is cumbersome for the subjects, and many times
does not yield the same quality and quantity of sleep as a subject sleeping in
familiar surroundings in their own bed. EEG systems that are take home devices
such as the Sleep Profiler have been developed and yield comparable sleep
architecture estimates to PSG [5]. In this study, the Sleep Profiler was used
as the reference device, reducing burden on study participants and allowing for
data collection in an environment identical to production use of the Garmin
wearable. The accuracy of the Sleep
Profiler was deemed to be comparable to a laboratory PSG.
Individuals in the study were trained
on use of the Sleep Profiler device and directed to wear the Garmin device on
the nondominant wrist. The Sleep Profiler device recorded three channel EEG for
sleep staging (as well as other measurements such as heart rate). The Garmin
device logged data simultaneously with the Sleep Profiler. Accelerometer x, y,
and z channels were recorded, along
with the wide bandwidth PPG signal. Only the green channel was used in this
study. Data was time aligned to within a second by setting the internal clocks of
both devices to the same time, and then comparing the heart rate output of the
Garmin device to the heart rate output of the Sleep Profiler, as these two
measurements were very similar, highly correlated, and yielded time alignments
of better than one second.
The Sleep Profiler output data, including
the automated sleep staging output, was then reviewed by a Registered
Polysomnographic Technologist using AASM guidelines [6] to provide the
reference sleep stages. Scoring was done at the 30-second epoch level. In this
case, N1 and N2 sleep stages were combined into a light sleep category. Wake, light,
deep (N3) and REM stages were then scored.
The scored data was then used to
train a neural network to perform the sleep stage classification. The neural
network architecture was chosen such that it could be realized in a production
system that included the wearable device, with somewhat limited computing
resources, and the Garmin cloud, which has extensive computing resources. In
the end, a two-stage approach was used, where data was pre-processed on the
wearable to segment and compress the wide bandwidth sensor data into a
manageable payload for syncing off the device via Bluetooth low energy (BLE) and
the Garmin Connect Mobile app to the Garmin cloud for further processing.
The neural network used in the
cloud was an adaptation and simplification of the architecture of Zhao [7].
Over 60 features were computed on the device. Seven more features were computed
on the cloud over the entire night’s data.
The network was trained using a k-fold cross validation re-sampling procedure with a k value of five [8]. In this method, the data was randomly sampled into five equally sized groups. The network was trained on four of the groups (80%), and scored on remaining group (20%). The training set was randomly subdivided into a training set and a validation set used to determine when to stop training the network. The stopping criteria used was a variation of the criteria given in [9]. This method was repeated five times such that each subject was used four times in the training set, and one time in the test set.
Results
55 individuals were recruited to
participate in the study. The only exclusion criterion was if there was a tattoo
on the dorsum of wrist that would interfere with the optical heart rate reading.
Of these 55 individuals, 14 indicated that they have a sleep disorder or take
medications that may impact sleep architecture. These individuals were noted, however
their data was still included in the study to represent the general population
and a percentage of real-world users with sleep disorders, whether known or
unknown. Of the 55 participants, 31% (17) were female
and 69% (38) were male. Age distribution was 35.5 +/- 8.7 years, BMI
distribution was 26.3 +/-6.4.
The overall accuracy of the algorithm against this real-world data was 69.7%, with the sensitivity in detecting sleep 95.8% and the specificity in detecting awake 73.4% (Table 1). The Cohen’s kappa (k) value is 0.54 +/- 0.12. These results should be assessed in light of the fact that the inter-scorer agreement between two trained human scorers using PSG is approximately 83% [10] with a Cohen’s kappa of approximately 0.78 [4].
Table 1. Sensitivity, Specificity, Accuracy, and
Cohen’s Kappa of Wearable Sleep Stage Classifier
| Sensitivity | 95.8% |
| Specificity | 73.4% |
| Overall accuracy (correctly classifying sleep stage) | 69.7% |
| Cohen’s kappa | 0.54 +/- 0.12 |
The full confusion matrix for the sleep stage classifier is given in Table 2. The matrix shows that that the classifier predicts deep, light, and REM sleep stages at roughly the same 69% accuracy rate. Wake is slightly more accurate at 73%. The most common mis-classifications are classifying true deep sleep as light sleep and classifying true REM sleep as light sleep.
Table 2. Confusion Matrix for All Participants
True Stage vs. Predicted Stage
| True Deep | True Light | True REM | True Awake | |
| Predicted Deep | 68.9% | 12.0% | 1.4% | 1.9% |
| Predicted Light | 29.1% | 68.6% | 26.4% | 14.9% |
| Predicted REM | 0.9% | 13.7% | 69.8% | 9.7% |
| Predicted Awake | 1.1% | 5.7% | 2.3% | 73.4% |
A comparison between the reference device and the wearable device of the overall sleep architecture for all 55 participants is given in Table 3.
Table 3. Sleep Architecture for All Participants
| % Deep | % Light | % REM | % Awake | |
| Garmin Wearable |
15.5% | 46.0% | 21.6% | 16.9% |
| Sleep Profiler |
12.7% | 50.7% | 18.3% | 18.3% |
It is important to note that the algorithm described in this paper was deployed into production on many Garmin wearable devices, including the vívosmart 3. During beta testing of the production implementation of the wearable sleep stage classifier, an additional 3,200 nights of data were analyzed and reviewed to ensure the results aligned with those of the 55-person study. There was no accompanying reference device data with these 3200 nights – only the production implementation using actigraphy and optical heart rate was used. On this larger cohort, the distribution of sleep stages as a function of age was used to assess algorithm performance. REM sleep distribution remained relatively constant as a function of age, deep sleep decreased markedly as a function of age, and total sleep time generally decreased with age – as expected [11].
Finally, some representative results from the cohort of 55 subjects are shown below. In the following figures, wake is represented as stage 3, REM as stage 2, light (N1 and N2) as stage 1, and deep as stage 0. Figure 2 shows the median result (27th of the 55 data sets when rank ordered by accuracy), with an accuracy of 71.5%.
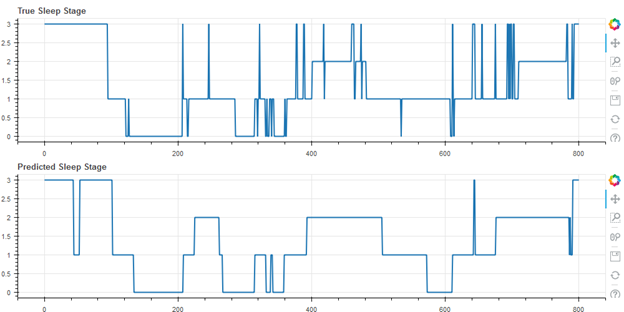
Figure 3 shows the best result of the cohort (first of 55), with an accuracy of 80.1%
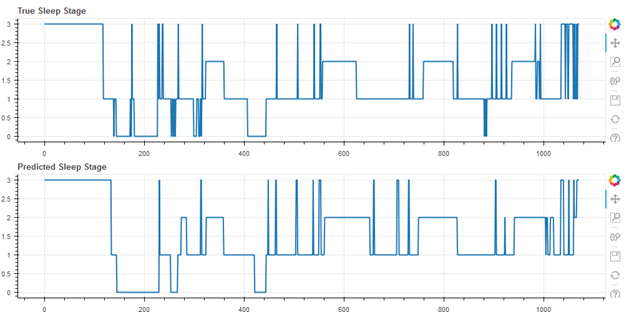
Figure 4 shows the worst result of the cohort (55 of 55), with an accuracy of 49.9%. Note that this user self-reported having a sleep disorder.
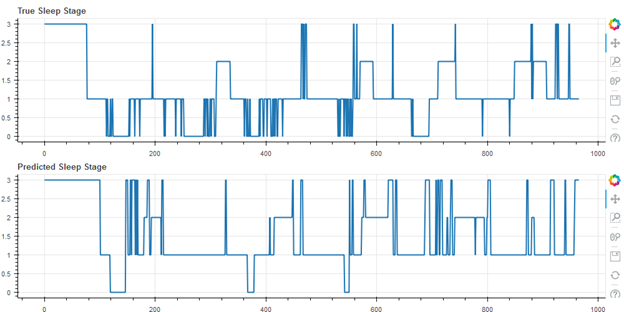
Worst Result, Accuracy 49.9%, Cohen’s Kappa 0.18 (Self-Reported Sleep Disorder)
Discussion
The work provides evidence that a
wearable device using only actigraphy and optical heart rate sensors can
estimate sleep stages of users to nearly 70% accuracy with a good Cohen’s kappa
of 0.54 +/- .12. This compares closely to the results in [4], despite the
increased challenges of production systems and real-world data collection. It
also compares favorably, but does not reach the same level of accuracy, as EEG
based sleep stage measurement devices, which reach an inter-scorer accuracy
level of 82%.
The major benefit to using a wrist wearable device to estimate sleep stages is the very low level of user friction involved – a user can simply wear the device on the wrist during sleep without cumbersome, special equipment. Use of a wearable for estimating sleep stages accurately allows for monitoring of sleep for virtually an unlimited number of nights, assuming the device is kept charged during the day, providing a user with useful data about sleep hygiene and sleep architecture.
References
- P Lamkin, Smart Wearables Market to Double by 2022: $27 Billion Industry Forecast,” Forbes, October 23, 2018. [Online]. Available: https://www.forbes.com/sites/paullamkin/2018/10/23/smart-wearables-market-to-double-by-2022-27-billion-industry-forecast/#419523e92656 [Accessed April 25, 2019]
- L de Souza, AA Benedito-Silva, ML Pires, D Poyares, S Tufik, HM Calil, “Further validation of actigraphy for sleep studies,” Sleep. 2003 Feb 1;26(1):81-5.
- J Mantua, N Gravel, R M. C. Spencer, “Reliability of Sleep Measures from Four Personal Health Monitoring Devices Compared to Research-Based Actigraphy and Polysomnography,” Sensors (Basel). 2016 May; 16(5): 646.
- Z Beattie, Y Oyang, A Statan, A Ghoreyshi, A Pantelopoulos, A Russell, C Heneghan, “Estimation of sleep stages in a healthy adult population from optical plethysmography and accelerometer signals,” Physiol. Meas. 38 (2017) 1968–1979.
- P Finan, J Richards, C Gamaldo, D Han, JM Leoutsakos, R Salas, M Irwin, M Smith, Validation of a Wireless, Self-Application, Ambulatory Electroencephalographic Sleep Monitoring Device in Healthy Volunteers, J. Clin. Sleep Med. 12 1443–50.
- Berry R B, Brooks R, Gamaldo C E, Harding S M, Lloyd R M, Marcus S L, Vaughn B V 2015 The AASM Manual for the Scoring of Sleep and Associated Events: Rules, Terminology and Technical Specifications, version 2.5 (Darien, IL: American Academy of Sleep Medicine).
- M Zhao, S Yue, D Katabi, T Jaakkola, M Bianchi, “Learning Sleep Stages from Radio Signals: A Conditional Adversarial Architecture,” International Conference on Machine Learning (ICML’17).
- J. Brownlee, “A Gentle Introduction to k-fold Cross Validation”, Statistical Methods, May 23, 2018. [Online]. Available: https://machinelearningmastery.com/k-fold-cross-validation/. [Accessed April 25, 2019].
- L. Prechelt, “Early Stopping – but when”, [Online]. Available: https://page.mi.fu-berlin.de/prechelt/Biblio/stop_tricks1997.pdf. [Accessed April 25, 2019].
- R Rosenberg, S Van Hout, “The American Academy of Sleep Medicine Inter-scorer Reliability Program: Sleep Stage Scoring,” J Clin Sleep Med. 2013 Jan 15; 9(1): 81–87.
- M Ohayon, M Carskadon, C Guilleminault, M Vitiello, “Meta-Analysis of Quantitative Sleep Parameters From Childhood to Old Age in Healthy Individuals: Developing Normative Sleep Values Across the Human Lifespan,” Sleep, 2004, 27(7):1255-73.