An Alternative Reference Index to Monitor Fatigue – Heart Rate Variability (HRV)
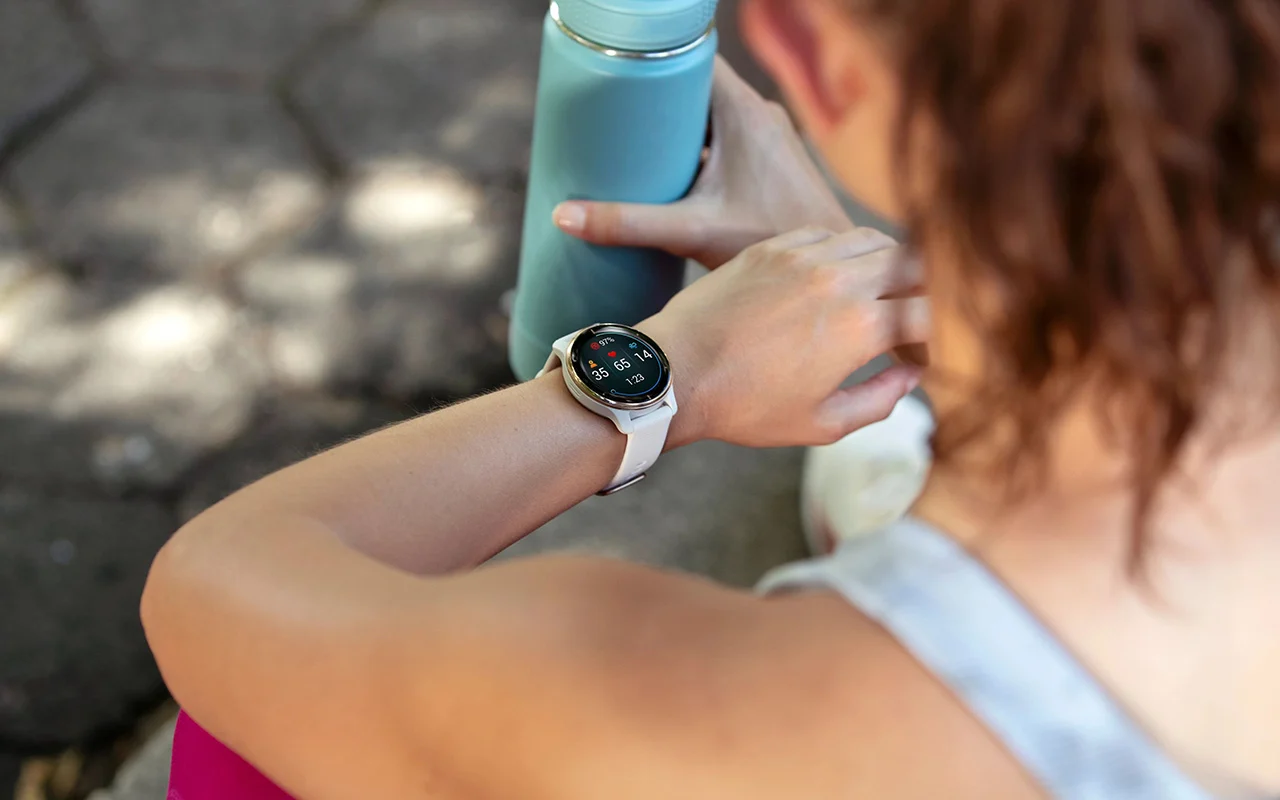
Now, a lot of information can be obtained at home, including step count, calories burned, weight, blood pressure, and heartbeat, etc. You are able to have a more advanced understanding of the state of your body. For runners, they can use their resting heart rate and other values to assess the stress from training. The theme introduced here “Heart Rate Variability (hereinafter referred to as HRV)” is also a reference factor for assessing physical fatigue.
What is HRV?
The heart doesn’t beat in a regular pattern like the metronome. HRV detects the time difference between each beat. This is mainly controlled by autonomic nervous system, which is split into two parts, sympathetic nervous system and parasympathetic nervous system.
Many physical states, including breathing, blood pressure, and digestion, etc., are controlled by it. When the state of the body is more urgent, the sympathetic nervous system is more active, while the parasympathetic nervous system takes over most parts when the body is in a relaxed state.
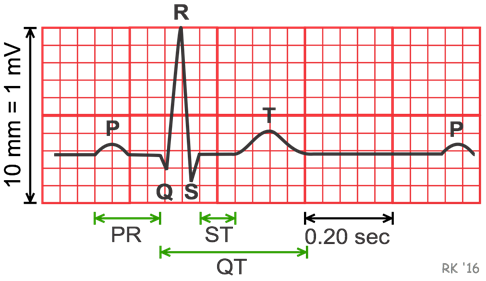
In the electrocardiogram, it is separated into waves PQRST, among which the distance between two R waves is called the R-R interval. HRV is the calculated variability between several R-R intervals. The frequency of breathing changes the central blood volume, which in turn changes the R-R interval.
More simply, HRV changes according to the interaction between the sympathetic nervous system and the parasympathetic nervous system, and can be used to further assess physical fatigue status and stress.
How to Measure HRV?
The methods of measuring HRV are mainly divided into time domain analysis and frequency domain analysis. Time domain analysis mainly uses math to calculate the variability between several R-R intervals. The recording method is relatively simple. Common heart rate monitor watches that have programs which support respiratory variability can be used to measure. Frequency domain analysis calculates the results using Fourier transform through the difference in the frequency domains of sympathetic nervous system and parasympathetic nervous system. In the past,
Garmin detected the HRV values through the heart rate band, but users had to face the discomfort of the heart rate band. Now, you can download the app through the Garmin Connect IQ store, and can use the wrist optical heart rate to carry out HRV measurement.

Practical Testing and Application of HRV
HRV is now considered as a potential reference factor for many heart diseases and is also an assessment of the prognosis of cardiac surgery. In training, this can be used as a monitoring for physical fatigue and stress. When the sympathetic nervous system is more active, the heart regularly beats at a faster pace, and when the parasympathetic nervous system is more active, the result is the opposite. Therefore, during fatigue or stress, the HRV value shown will be lower than normal (each person’s reference value is different).
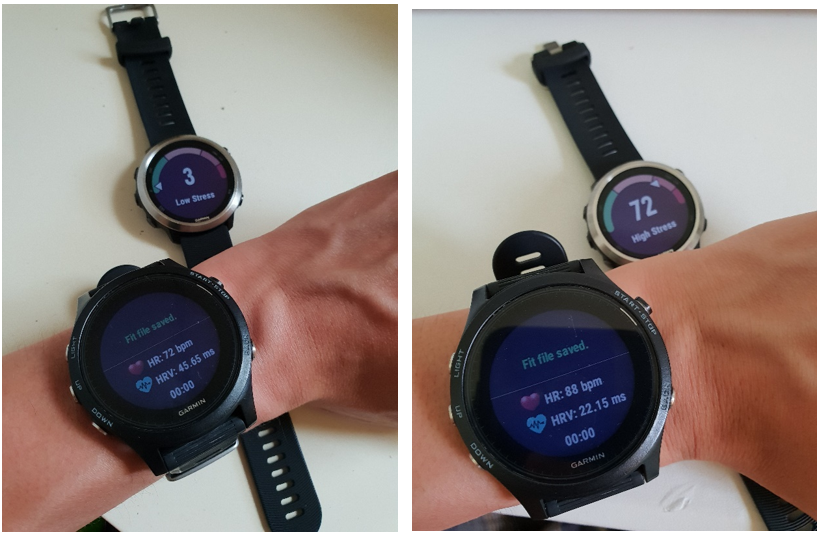
The following is the actual measurement of HRV monitoring that I did using the HR Variability app along with the Forerunner 935 optical heart rate. This is mainly divided into after waking up (AWU), before bed (BB), and after exercise (AE). These are all done in the standing position, the data I obtained are as follows:
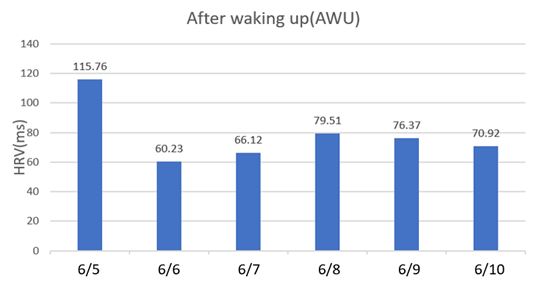
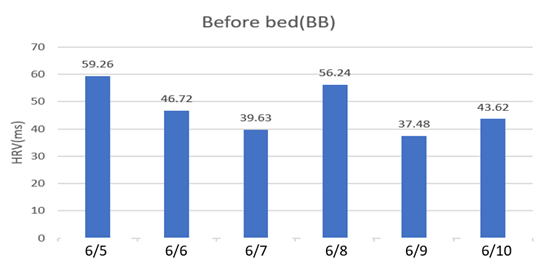
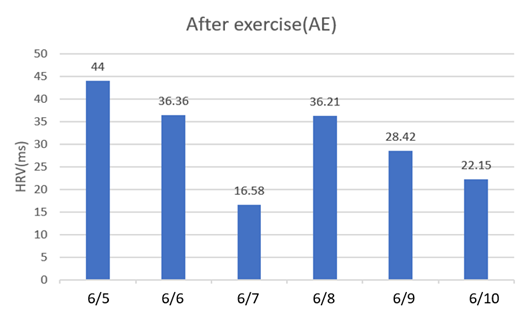
We can see that the HRV index after exercise is significantly lower, indicating that the current exercise at the time exerts a certain pressure to the body. As the intensity of the exercise changes, it causes different levels of pressure. Then, how should we assess how our bodies are recovering after training? I chose two different days after training to carry out HRV monitoring every three hours, and the results are as follows:
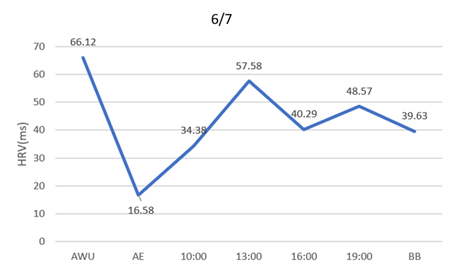
From the line chart, we found out that a certain amount of pressure is exerted to the body after exercise, which is in turn reflected on the changes of HRV. Next, as time passes, it gradually returns to the baseline and returns to the highest point after sleep. Next, let’s look at the trend chart of carrying out two running exercises in one day:
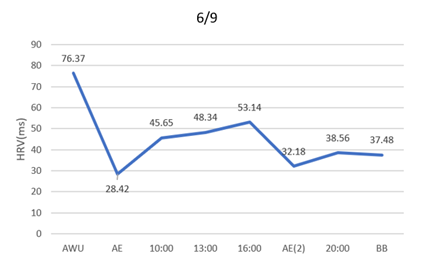
From the chart, we could see that after experiencing the pressure after the first exercise, the body gradually returns to the benchmark. After the second jog, the HRV dropped slightly, which indicated that jogging still gives a little pressure to the body. The value returns to the base after sleep.
The new version of the HRV app can carry out the measurement at any time using the wrist optical heart rate. Compared to the built-in HRV Stress Test in watches where you must wear the heart rate band, this new version appears to be more convenient. The data obtained in the new app is raw data, while the HRV Stress Test displays the stress index after calculation.
In addition to the resting heart rate, HRV can also be used as a reference factor when assessing fatigue, especially applying it to our daily lives and not limiting it to just getting out of bed. We can assess the body’s stress recovery after training as a reference when carrying out my second jog in the afternoon.
However, just like heartbeat, everyone is unique in terms of HRV. We can collect your own long-term data in order to establish our own reference value, but don’t compare with others. Lastly, HRV measurement has its own limitations; therefore, the wrist optical heart rate measurement might not be as accurate as ECG or the heart rate band. However, I believe that it is still a very simple and convenient tool to monitor oneself.