Coach’s Corner: What Data Fields To Have On Your Garmin Edge Bike Computer
This month, our resident cycling coach Matt Rowe gives his tips and favourite data fields to have on his Garmin Edge bike computer.
Scrolling through the plethora of data fields that can be displayed on your Garmin Edge device, you would be forgiven for grabbing a cup of coffee first. It’s a long list, but you can pick and choose from a wide range of data field options that you would like on your screen. Check out how to customise data screen on your Edge bike computer here.
Note – Some data fields require optional accessories to display data, i.e. to display heart rate related data, you need a heart rate monitor!
So, which data fields should you be using?
This question is a bit like asking ‘how much training should I do’ – the answer being, ‘it depends!’ What type of riding do you do – road, mountain biking, gravel, other?
Are you competitive and want to complete some structured intervals, in which case displaying power data, and capturing your ‘lap data’ could be critical. Or are you more adventurous and out on your bike purely to explore, in which case Garmin Maps is likely your go-to display.
With all the above in mind, I am going to talk you through the data fields and how I use my Garmin Edge 1030 bike computer when I’m riding, which will hopefully give you some food for thought in deciding which data fields to have on display for your next ride.
The ‘go-to’ data that I like to have on hand is split across;
- My primary data screen that is on display for most of my ride; and
- Special screens, which I use for a specific purpose at points in my ride.
Data Fields On My Primary Data Screen
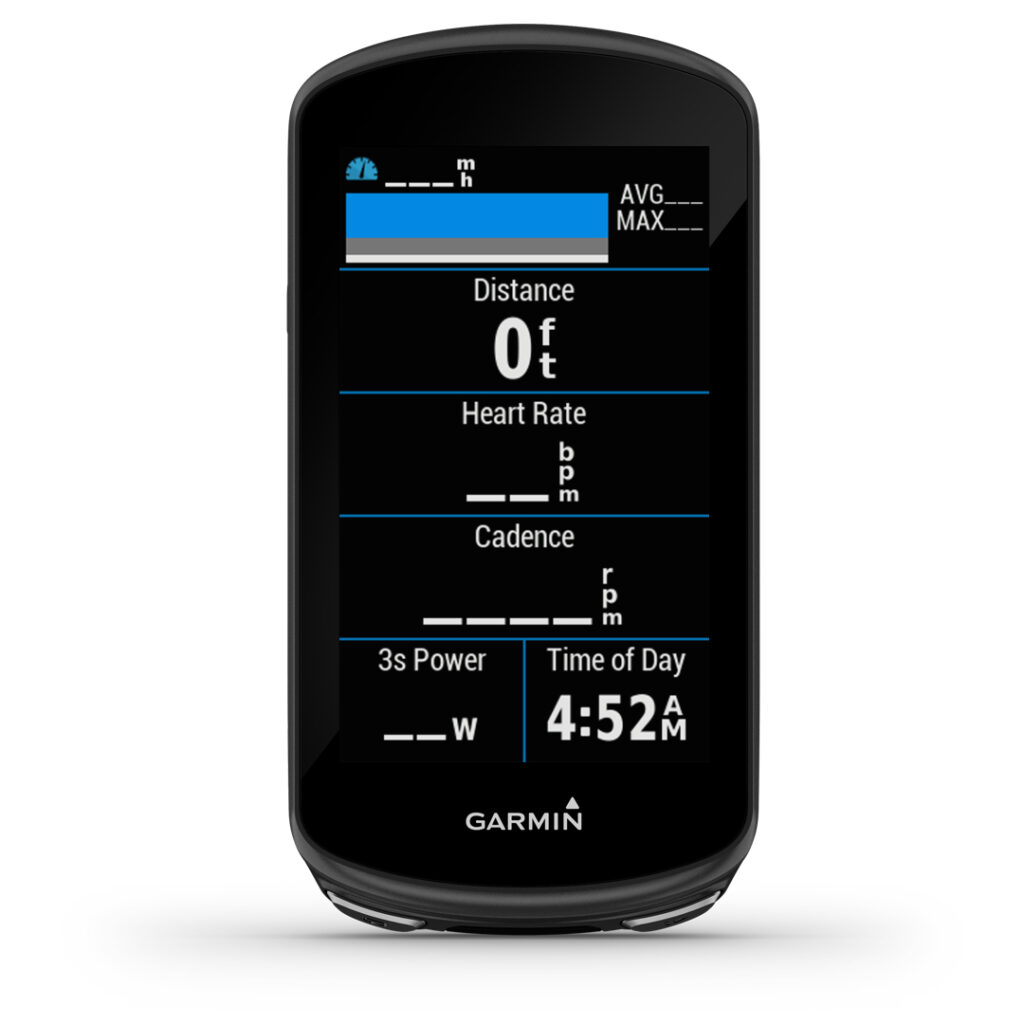
On my primary data screen, the following 4 metrics are important to me.
3s Power
The 3-second moving average of power output (device must be connected to a compatible power meter)
This informs me instantly of how hard I am pushing. It’s surprising how your power shoots up as soon as you go uphill. Knowing my current power helps me pace myself much better, especially if I am going to do a max effort as I am able to pace myself in relation to my personal best power output over a given duration.
Heart Rate
Heart rate in beats per minute (bpm) (device must be connected to a compatible heart rate monitor)
The relationship between heart rate and power is powerful, in being able to determine your physical working capacity for example. For a given heart rate, i.e. 140bpm, how much power can you produce? As your fitness improves, you should be able to produce more power for the same heart rate, effort, or physiological cost.
Heart rate can also offer an early warning indicator of illness and fatigue.
Cadence
The number of revolutions of the crank arm, per minute (device must be connected to a cadence accessory for this data to appear)
Whilst there is not an optimum cadence across all disciplines of cycling (physiology and discipline / event being two major factors), for the average road cyclist, between 80 and 90rpm is considered ‘good’. Whilst the desire for economy, efficiency and pure speed may result in differing target cadences, one thing’s for sure – you need to track your cadence.
Time of Day
Between meeting friends for a ride and having to get back for at home, I never want to be late!
Speed Bars
A bar graph showing your current, average, and maximum speed values for the current activity, all neatly wrapped up in to one graphical data field. Pound for pound, the best utilisation of screen space!
My Favourite Screens
I can’t mist My favourite screens, which are only ever a swipe away:
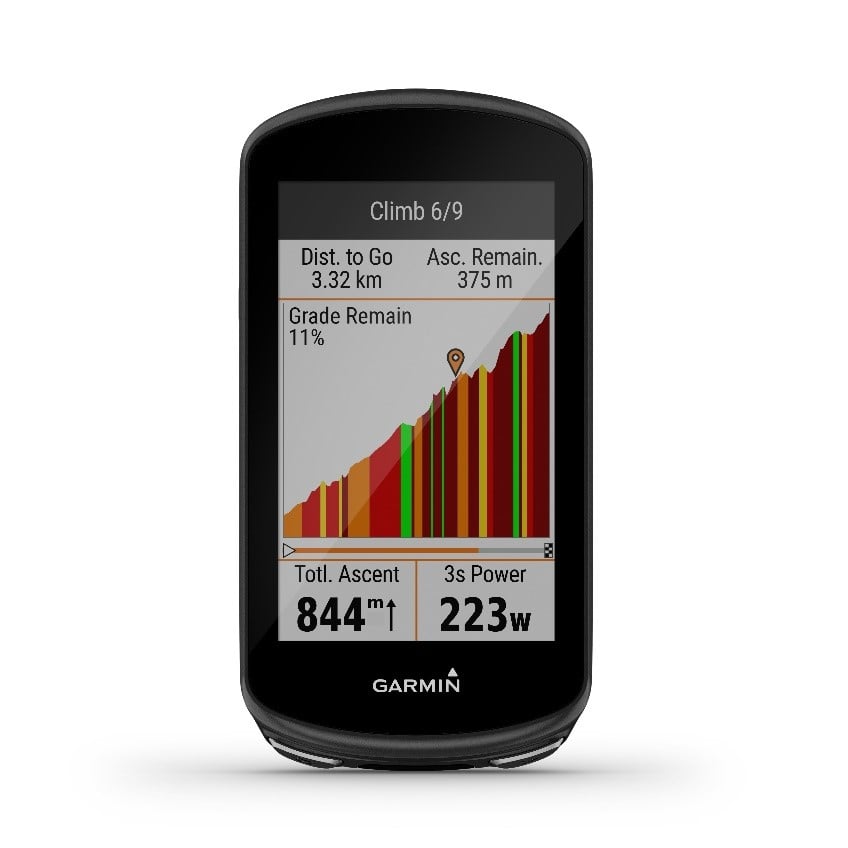
ClimbPro
Once a course is created and sent to your compatible device, ClimbPro allows you to view details about the climbs before and during your ride, including the number of climbs, when they occur, average gradient, and total ascent. A fantastic feature for helping you to pace yourself up individual climbs, but also throughout your ride as a whole.
Picture yourself out on your bike, 20km from home. Scenario A – ClimbPro is showing you have one climb left, and its 1.5km long at a gradient of 6%. Get to the top and it’s a fast ride home. Alternatively, in scenario B, your final 20km takes in 4 climbs, with the penultimate climb being 4km at 9% – your approach to each of these scenarios will be wildly different! Insights from ClimbPro will impact your next pedal strokes!
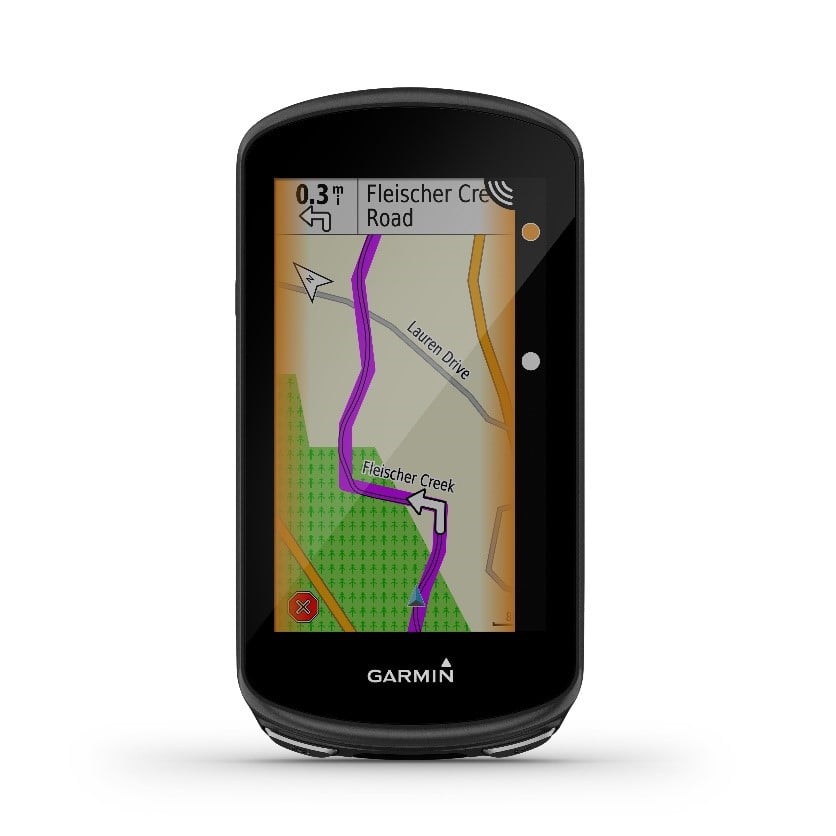
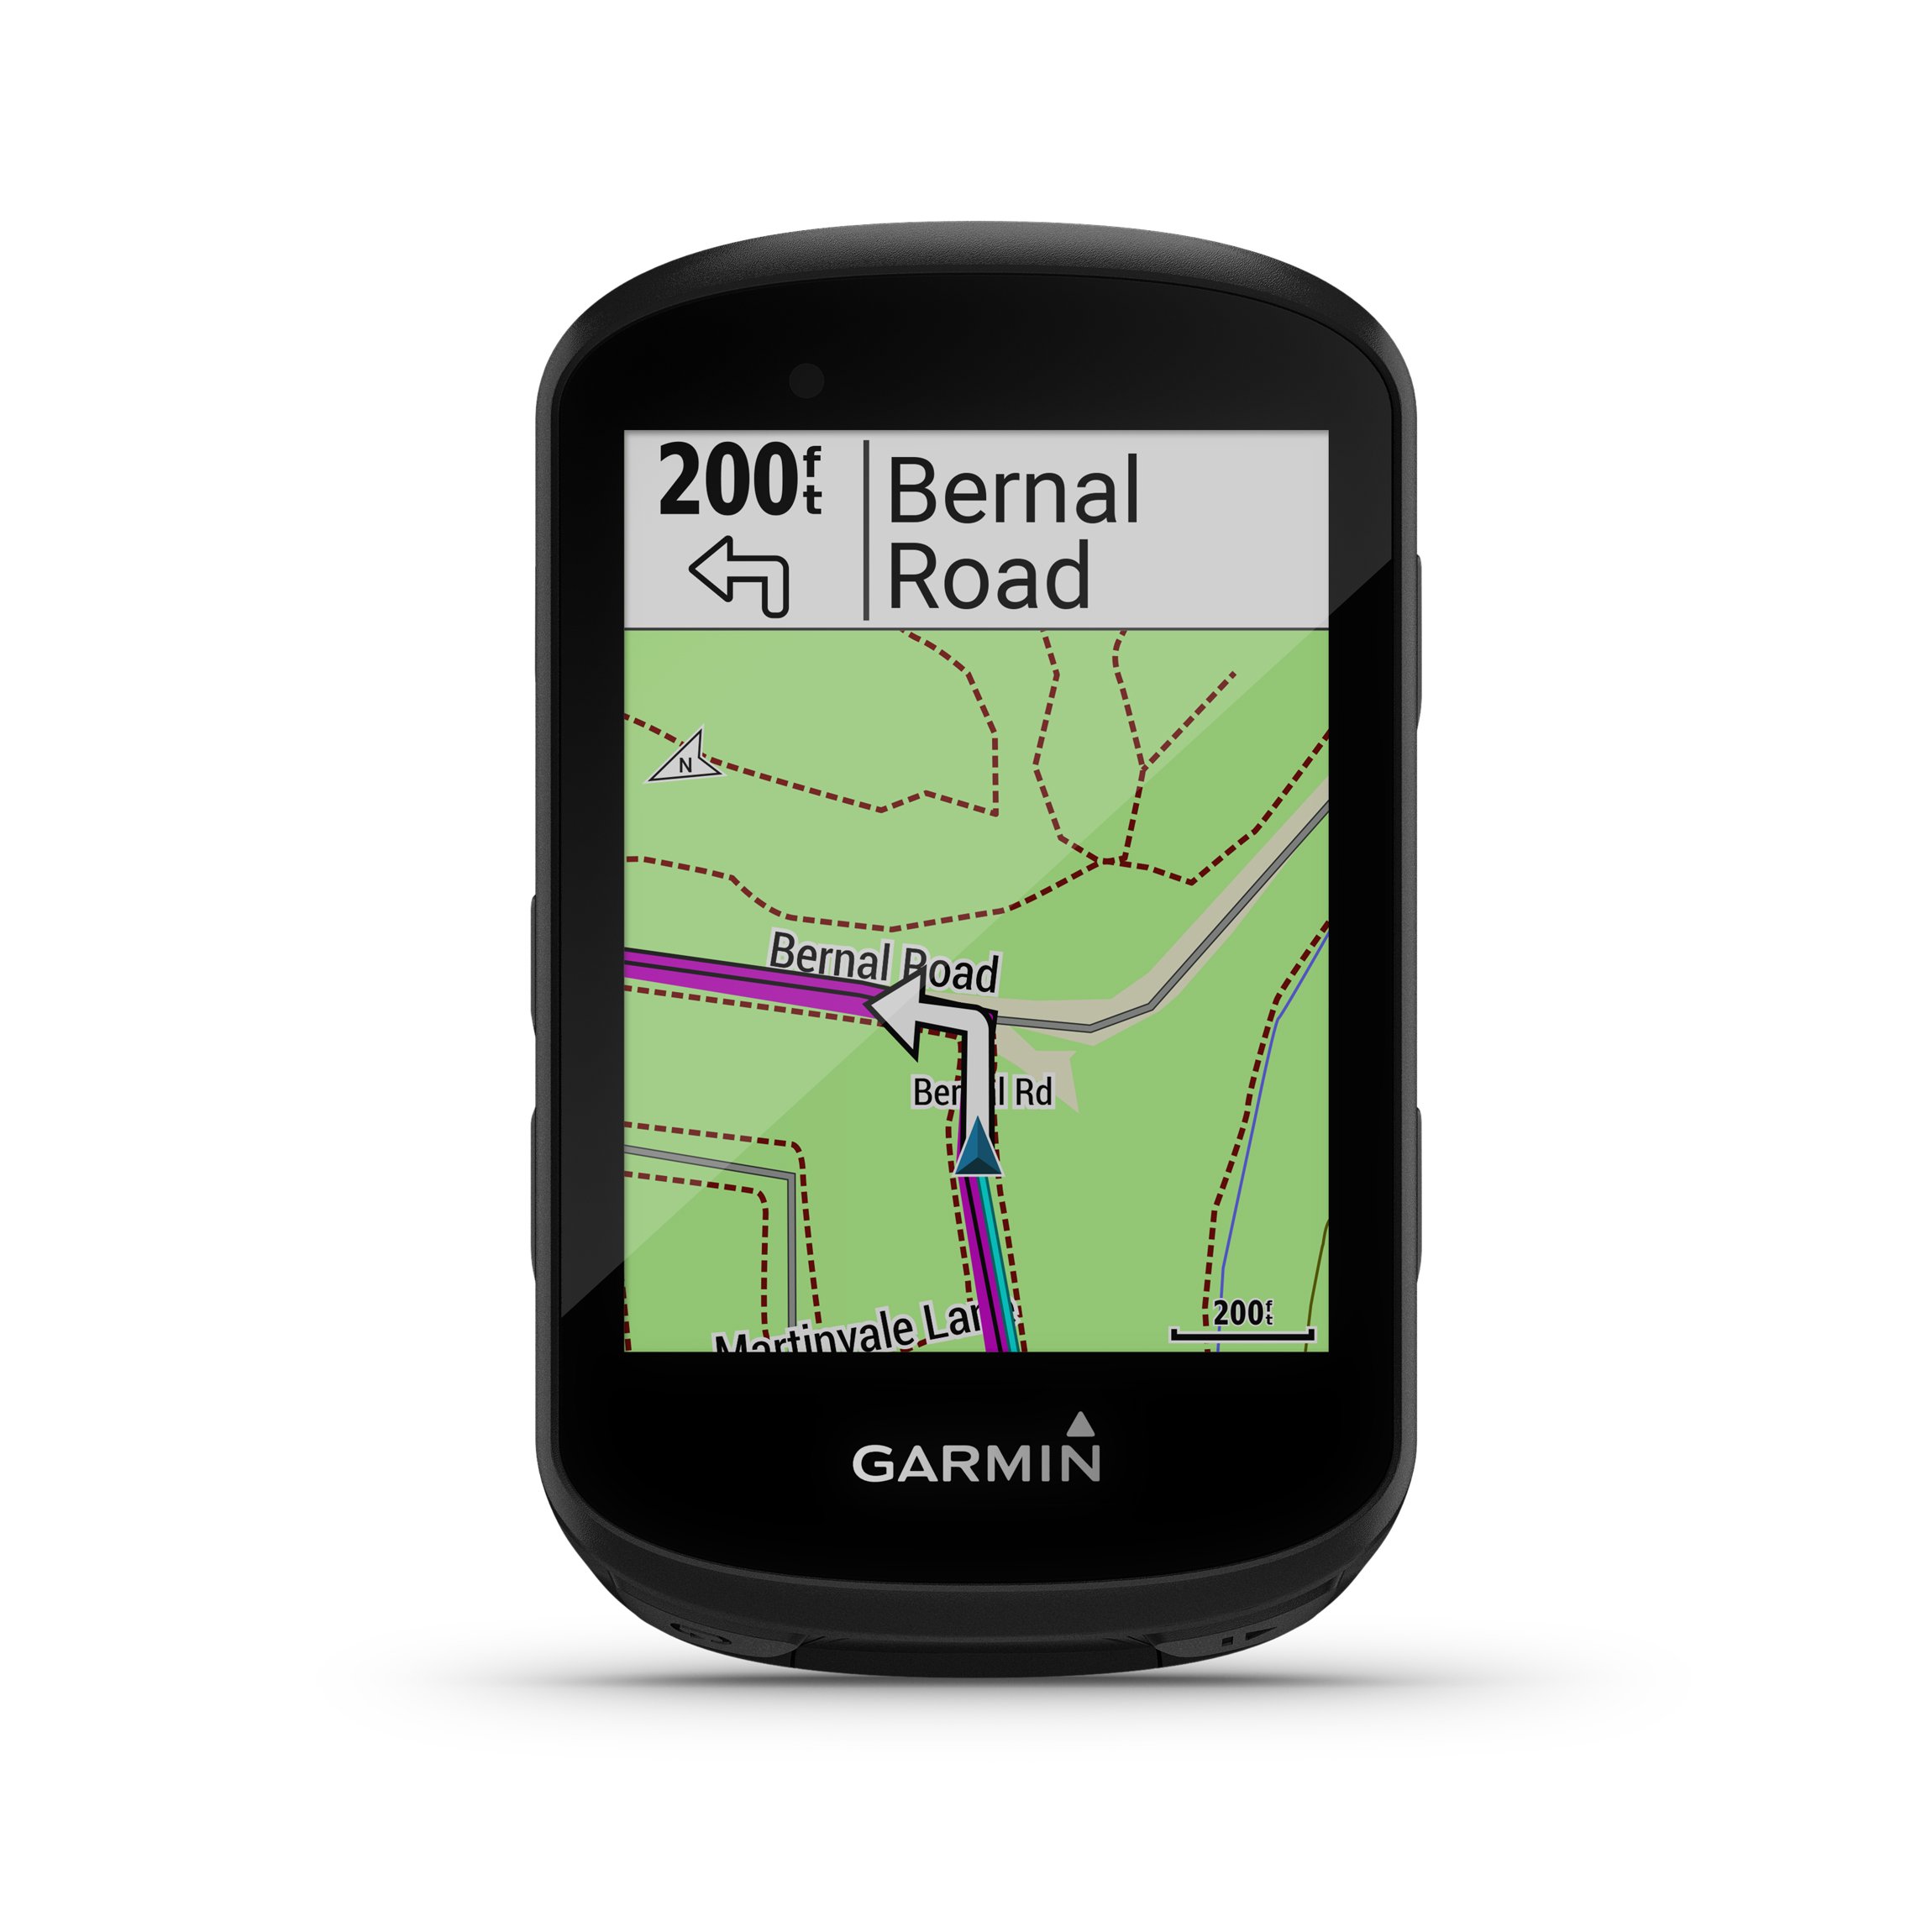
Map
Having a sense of where I am currently riding is nice to know, not least because it’s quite interesting to know where you are and what you are close to. I may be tempted to make a detour if I see somewhere interesting like a reservoir, just off route. Plus – a map is obviously vital for navigating new roads.